Using the System Monitor
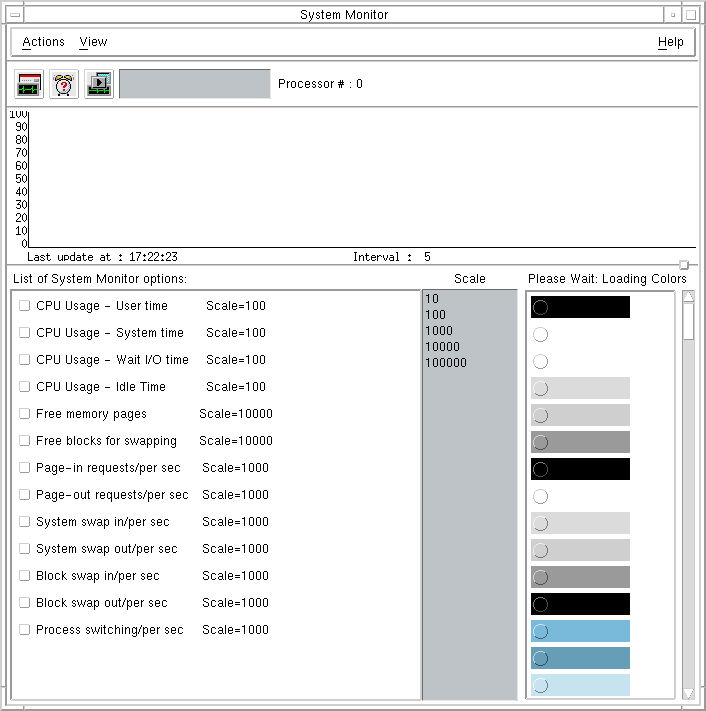
The System Monitor window allows you to graphically display
information about activity on your system.
This includes information about CPU usage, free memory,
free blocks, paging, and swapping.
The System Monitor is
accessible from the System folder of the
scoadmin(ADM)
launcher, or by entering scoadmin system mon on the
command line.
NOTE:
Evaluating system performance accurately and tuning for optimal
performance are complex tasks that can have significant impact
on your system.
The System Monitor is only one of many tools available.
See
Monitoring and tuning the system
for more detailed information on monitoring and tuning your system.
The System Monitor is not available in character mode.

System Monitor
The chart near the top of the System Monitor displays a
line representing each of the selected monitor options.
By default, no options are selected.
Once selected, each option is represented by a different line on the chart.
As each of the monitored values change, the chart is updated.
By default, the monitor updates every five seconds.
See
sar(ADM)
for descriptions of the system monitor options.
You can change the following chart parameters:
Resize within the window-
Press the left mouse button on the small square on the right side of
the line that divides the top and bottom sections of the window.
Hold the mouse button and move up or down to increase either the top or
the bottom area.
Turn display on or off-
click on the check button next
to each option to turn on or off the associated display.
Change colors-
click on an option and then on a color on the right side of the window.
This changes the color of the line representing the previous option selected.
See
``Customizing System Monitor colors''
for more information.
Change scale-
click on a number in the middle of the
window (``10'', ``100'', and so on) to change the scale for
selected option is presented.
The scale for the four ``CPU Usage'' options cannot be changed
(because they can only be shown as a percentage, such as, out of ``100'').
You can display options, log your processor, or play back
messages using the menu bar or the tool bar.
Instructions for using the menu bar are given in the following sections.
To use the tool bar, click on the desired icon directly
under the menu bar and the next window opens.
Each icon represents a different monitor function.
When you position the mouse pointer over the icon, your system
identifies the icon as (from left to right): ``Options'',
``Alarm'', or ``Playback''.
(``Alarm'' appears only if an option
has been selected the ``List of System Monitor options''.)
Next topic:
Managing log data
Previous topic:
Using the System Time Manager
© 2007 The SCO Group, Inc. All rights reserved.
SCO OpenServer Release 6.0.0 -- 05 June 2007

